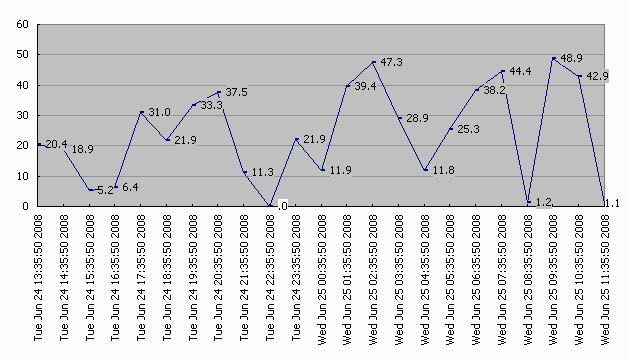
用Win32::OLE和Microsoft Graph畫圖
use strict;
use Win32::OLE qw( with in );
use Win32::OLE::Const "Microsoft Graph 9.0 Object Library";
my (%t,@CELLS,$Value,$Point);
$t{TIME} = time();
$t{WIDTH} = 640;
$t{HEIGHT} = 400;
( @CELLS ) = ( 'a'..'zz' );
$t{File} = "c:\\temp\\test.gif";
srand( time() );
$t{Class} = "MSGraph.Application";
$t{Chart} = new Win32::OLE( $t{Class} ) || die "GO Away. Can not create '$t{Class}'\n";
$t{Chart}->{Visible} = 1;
$t{Data} = $t{Chart}->DataSheet();
$t{Graph} = $t{Chart}->Chart();
$t{Graph}->{Width} = $t{WIDTH};
$t{Graph}->{Height} = $t{HEIGHT};
$t{Graph}->{HasLegend} = 0;
$t{Graph}->{Type} = xlLine;
# Align the chart so it starts on the origin
$t{Graph}->ChartGroups(1)->{HasUpDownBars} = 1 ;
$t{Graph}->ChartGroups(1)->{HasUpDownBars} = 0;
# Add data to the graph
foreach $Value ( 0 .. 22 )
{
$t{Date} = localtime( $t{TIME} + 3600 * $Value );
$t{Data}->Range( "$CELLS[$Value]0" )->{Value} = $t{Date};
$t{Data}->Range( "$CELLS[$Value]1" )->{Value} = rand( 50 );
}
# Config the x-axis
if( $t{Axis} = $t{Graph}->Axes( xlCategory ) )
{
$t{Axis}->{HasMajorGridlines} = 0;
$t{Axis}->{TickLabels}->{orientation} = xlUpward;
with( $t{Axis}->{TickLabels}->{Font},
Name => "Tahoma",
Bold => 0,
Italic => 0
);
}
# Config the y-axis
if( $t{Axis} = $t{Graph}->Axes( xlValue ) )
{
$t{Axis}->{HasMajorGridlines} = 1;
$t{Axis}->{MajorGridlines}->{Border}->{Weight} = 1;
# The color index 48 == 40% gray
$t{Axis}->{MajorGridlines}->{Border}->{ColorIndex} = 48;
$t{Axis}->{MajorGridlines}->{Border}->{LineStyle} = xlContinuous;
with( $t{Graph}->Axes( xlValue )->{TickLabels}->{Font},
Name => "Tahoma",
Bold => 0,
Italic => 0
);
}
# Configure the data point labels for the series collection
$t{Graph}->SeriesCollection( 1 )->{HasDataLabels} = 1;
if( $t{Labels} = $t{Graph}->SeriesCollection(1)->DataLabels() )
{
with( $t{Labels},
NumberFormat => "#.0",
Type => 'xlDataLabelsShowValues'
);
with( $t{Labels}->{Font},
Name => "Tahoma",
Bold => 0,
Italic => 0,
);
}
# Remove any data point labels if they are redundant
foreach $Point (in( $t{Graph}->SeriesCollection( 1 )->Points()))
{
$t{Text} = $Point->{DataLabel}->{Text};
$Point->{MarkerStyle} = xlMarkerStyleDot;
$Point->{DataLabel}->{Font}->{Background} = xlBackgroundOpaque;
$Point->{HasDataLabel} = 0 if( $t{Text} eq $t{PrevText} );
$t{PrevText} = $t{Text};
}
$t{Graph}->Export( $t{File}, "GIF", 0 );
`start $t{File}`;
返回
张家港市|
浏阳市|
东宁县|
泌阳县|
汶川县|
榆树市|
瑞安市|
车险|
常宁市|
龙江县|
西安市|
新邵县|
翼城县|
眉山市|
濮阳市|
神池县|
苍溪县|
广丰县|
子长县|
增城市|
上犹县|
巨野县|
南昌县|
永春县|
鄂尔多斯市|
德昌县|
宽甸|
诏安县|
阿荣旗|
安平县|
临湘市|
丰都县|
潢川县|
牡丹江市|
锡林浩特市|
景洪市|
无极县|
庆云县|
华蓥市|
长岭县|
桐柏县|